1 in 4 Americans are uncertain about Trump impeachment, poll finds
- Share via
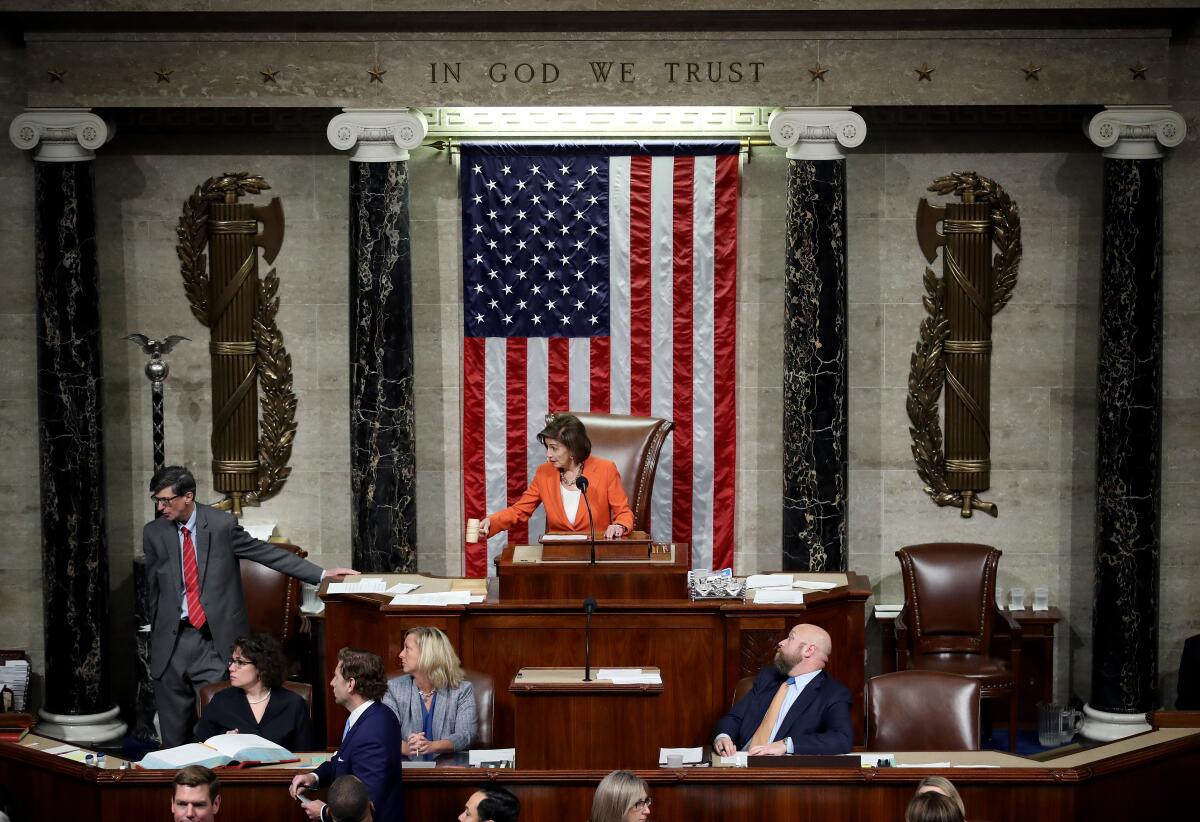
WASHINGTON — Americans are divided about the impeachment inquiry into President Trump, and as the House prepares for public hearings next week, roughly 1 in 4 remain uncertain, providing a large audience that could be especially swayed by the evidence, a new poll shows.
Currently, 44% say the House should vote to impeach and 30% say it should not, according to the latest USC Dornsife/Los Angeles Times nationwide poll. But 26% say they either don’t know or that it’s too soon to tell.
Those uncertain Americans will be a targeted audience when public hearings begin into Trump’s actions toward Ukraine. The hearings are scheduled to start Wednesday, with the first witness set to be William B. Taylor Jr., the top U.S. diplomat in that country.
Taylor has already told House investigators in a deposition that Trump withheld aid from Ukraine as leverage to prod the country’s leaders into publicly announcing an investigation into former Vice President Joe Biden, according to a transcript released Wednesday by House Democrats.
Asked whether the Senate should convict Trump and remove him from office if the House impeaches him, Americans split along lines nearly identical to their feelings about a House impeachment vote, with 45% saying Trump should be removed, 28% saying he should not be and 28% saying they are unsure or that it’s too soon to say, the poll found.
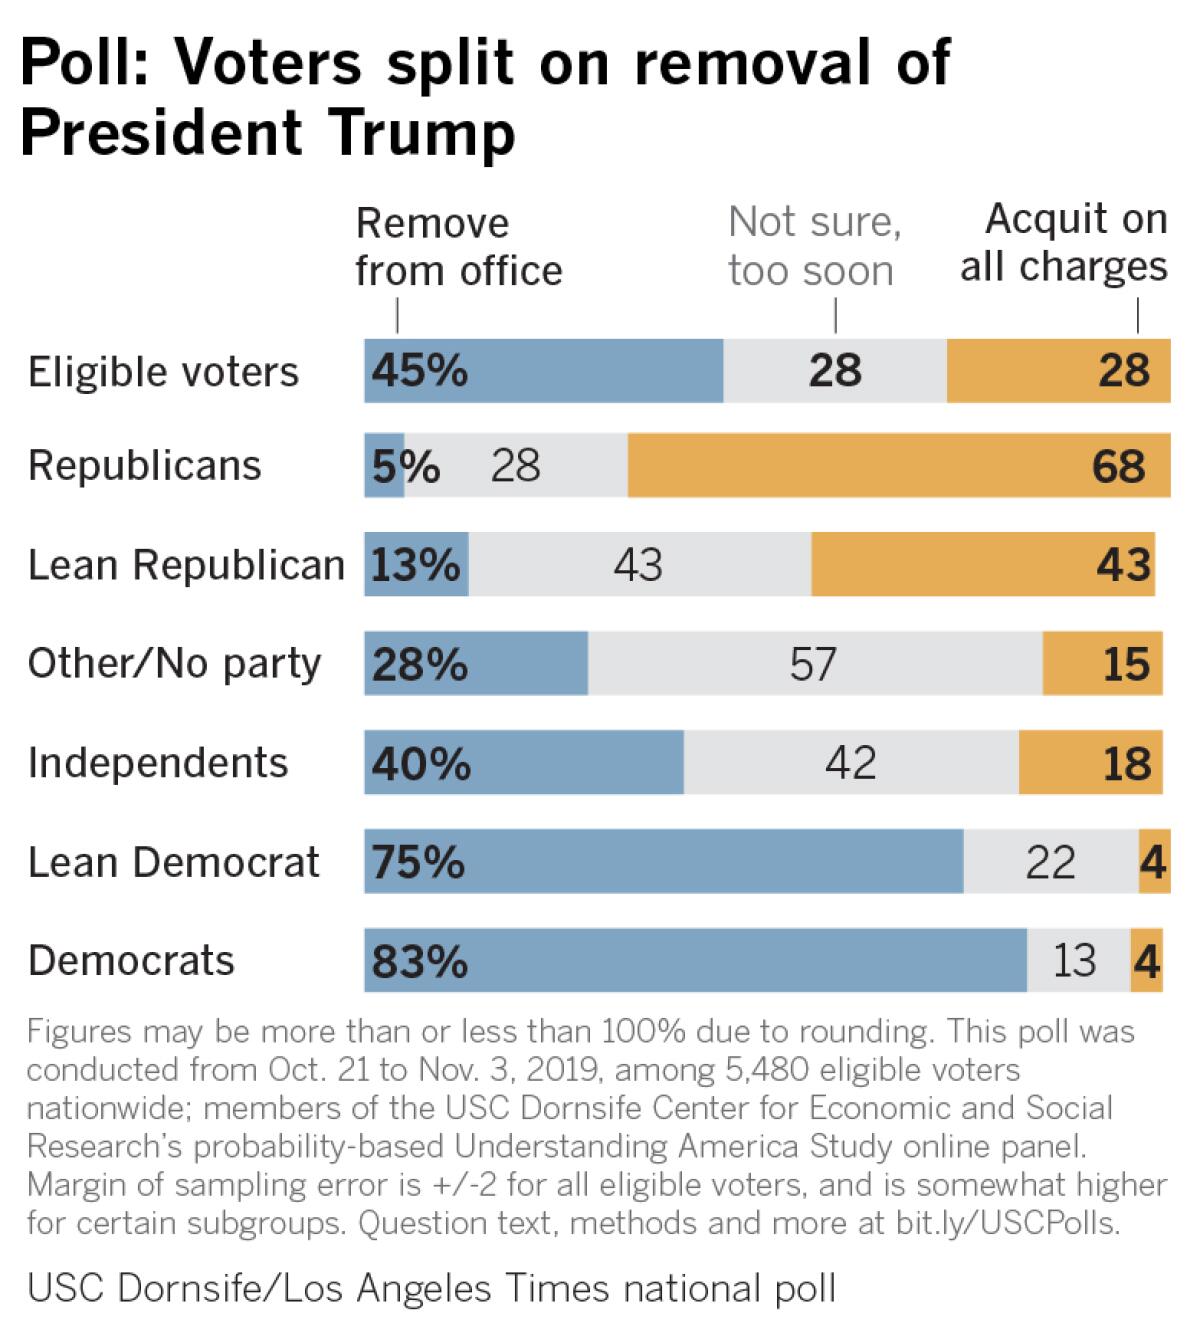
Unlike many other recent surveys on impeachment, the USC Dornsife/L.A. Times poll gave people the explicit choice of saying that they remained uncertain or that it was too soon to tell; many other polls allow people to volunteer that they haven’t made up their minds but don’t provide that as an explicit choice.
Compared with other polls that offer only “yes” or “no” options, offering uncertainty as a choice appears to reduce support for both sides, but not equally: Support for impeachment appears more solid than opposition.
That finding is consistent with many other measurements regarding the president almost throughout his tenure: A large share of Americans solidly opposes him, a smaller share solidly backs him and a third group generally supports him but sometimes wavers.
In the current poll, for example, a majority of respondents, 52%, say they would be unhappy if Trump were reelected, and just 30% say they would be happy. While 40% say they would be “completely unhappy,” about half of that number say they would be “completely happy.” And 18% sit in the middle.
Technologists unveil the first significant effort to arm reporters and campaigns with software tools to combat the growing problem of “deep fake” videos. The effort faces formidable hurdles — both technical and political — and developers say there’s no time to waste.
The roughly 1 in 4 Americans who say that they haven’t made up their minds on impeachment provide a potentially important but elusive audience for the two warring sides.
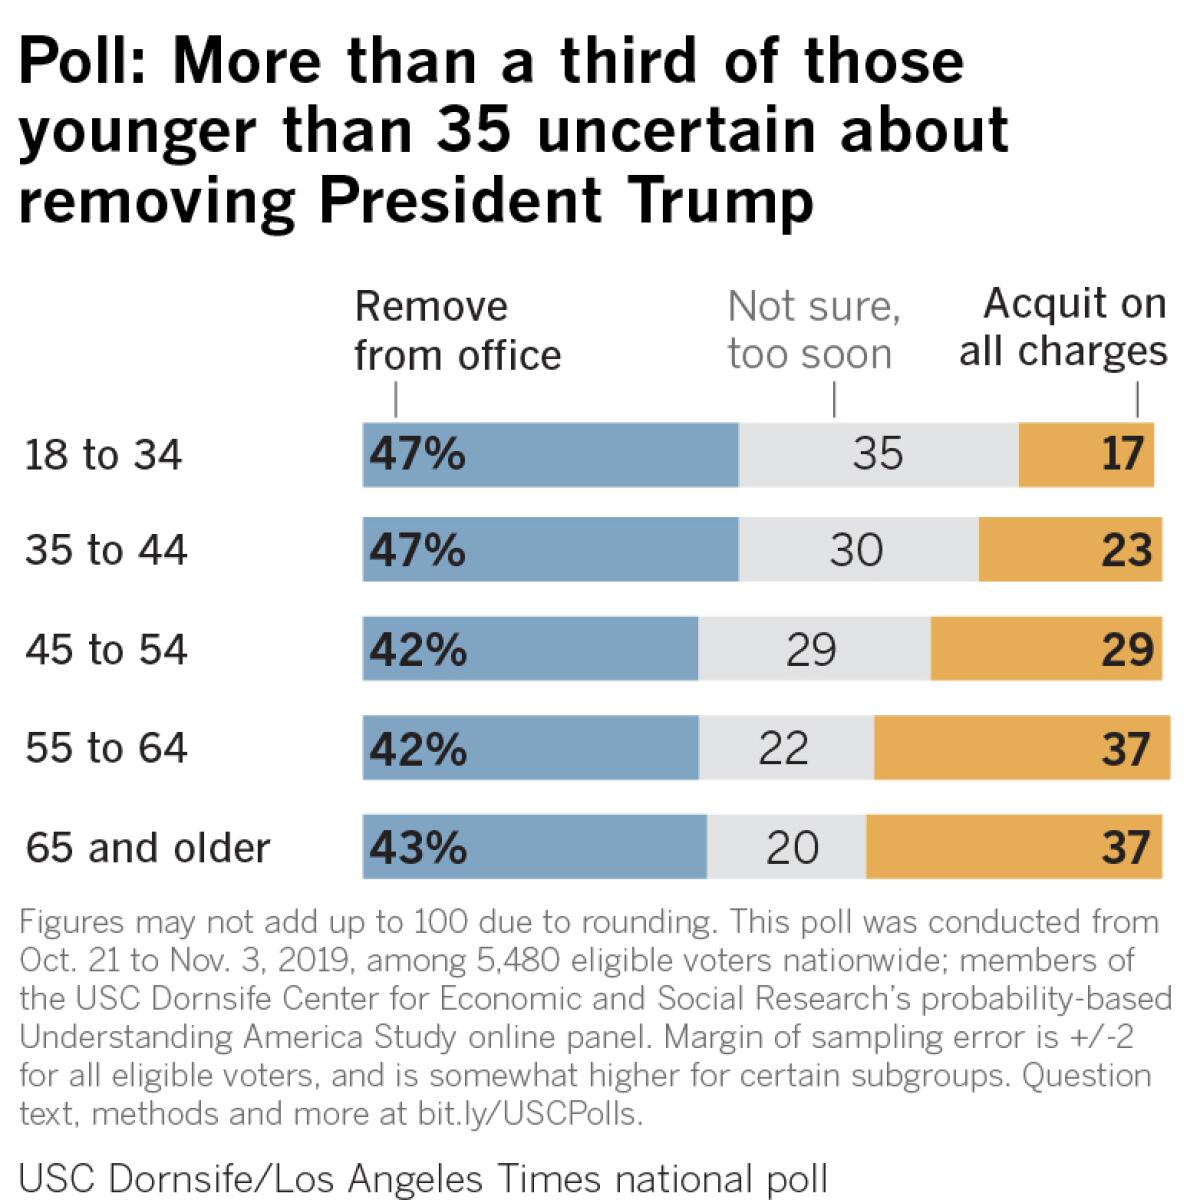
The groups most likely to remain undecided include independents and people who describe themselves as only leaning toward the Republicans. The undecided also tend to be younger than average: More than a third of people younger than 35 say they are uncertain, but only a fifth of those 65 and older replied the same.
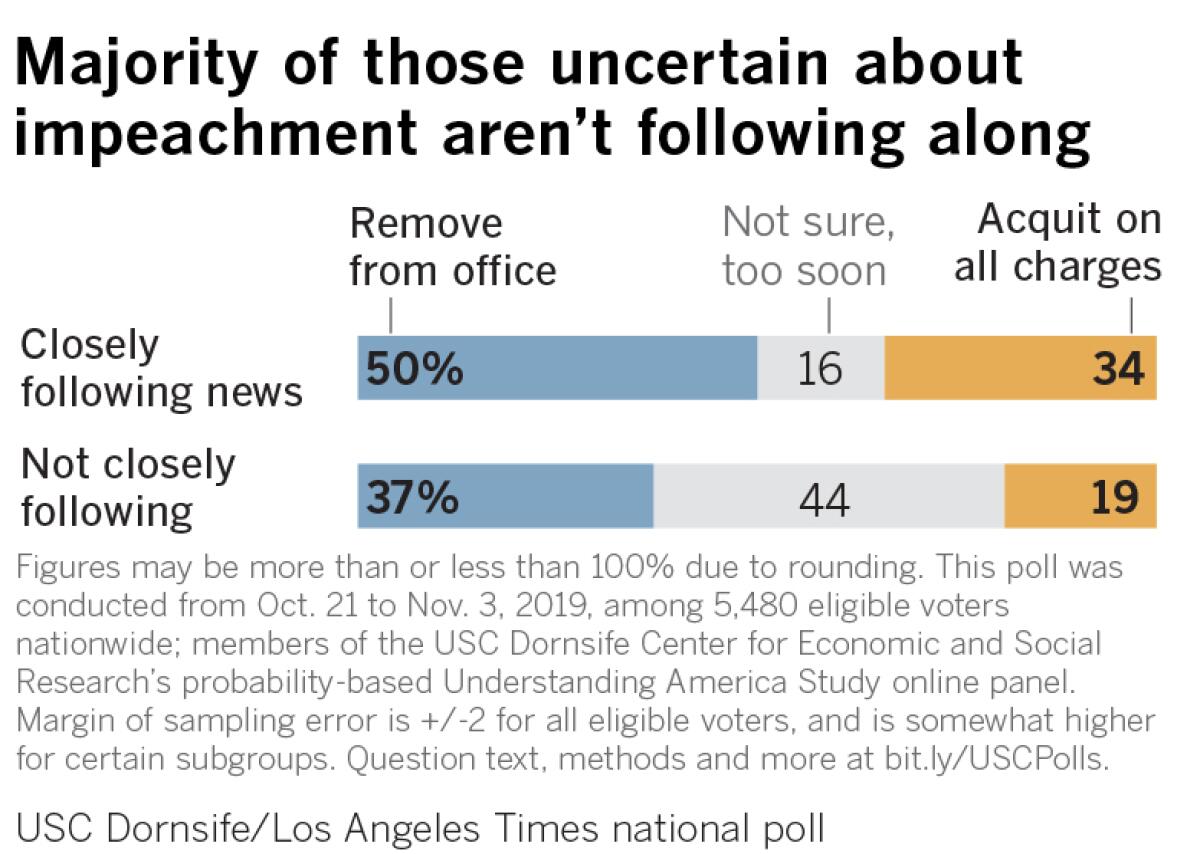
But the central fact about the undecided is that they haven’t been paying much attention. The 60% of Americans who say they are following news about impeachment at least “somewhat closely” have mostly made up their minds. Among the people who say they remain uncertain, about two-thirds say they aren’t following the issue closely.
That’s typical in today’s highly polarized political environment: The people who pay most attention to news tend to be the most partisan. One challenge for the House Democrats managing the impeachment hearings will be whether televised public hearings can grab the attention of those who, so far, have mostly tuned out the case.
Expectations could provide another challenge. Most Americans don’t expect to see Trump removed from office as a result of the impeachment process. On average, those polled gave removal about a 30% likelihood of happening. Even Democrats, on average, gave it only about a 40% chance of happening.
The impeachment debate does not appear to have changed Trump’s prospects for reelection, which were dicey before and haven’t improved.
Like most other national surveys this year, the current poll shows most Americans saying they plan to vote against Trump for reelection. Just over half of those polled, 54%, said they would vote for the eventual Democratic candidate, 33% said they plan to vote for Trump, and 13% said they expect to vote for someone else. In past elections, support for a third party almost always dwindles as the election gets closer.
The poll’s findings are roughly consistent with other surveys that have tested Trump against Democratic opponents nationally, although he does better in matchups with specific Democratic candidates in closely divided battleground states.
Strategists in both parties typically believe Trump will lose the popular vote in 2020, perhaps by an even larger margin than in 2016. Trump’s campaign aides maintain that he can win reelection by once again eking out narrow victories in key states even as he loses big elsewhere. A lot of Americans seem to share that belief — those polled give Trump just over a 50% chance of winning again.

Looking at the field of Democrats vying to run against Trump, the poll finds Biden leading nationally, with 28% of the vote, compared with 16% for Sen. Elizabeth Warren of Massachusetts; 13% for Sen. Bernie Sanders of Vermont; 6% for Mayor Pete Buttigieg of South Bend, Ind.; and 4% for Sen. Kamala Harris of California. No other candidate gets more than 2%.
Since previous USC/Los Angeles Times polls, Harris’ standing has dropped steadily, from 10% in July to 8% in September to 4% now. Warren’s backing has continued to rise and is now four times higher than it was in April, when the poll first measured the candidates. Buttigieg’s support has also grown.
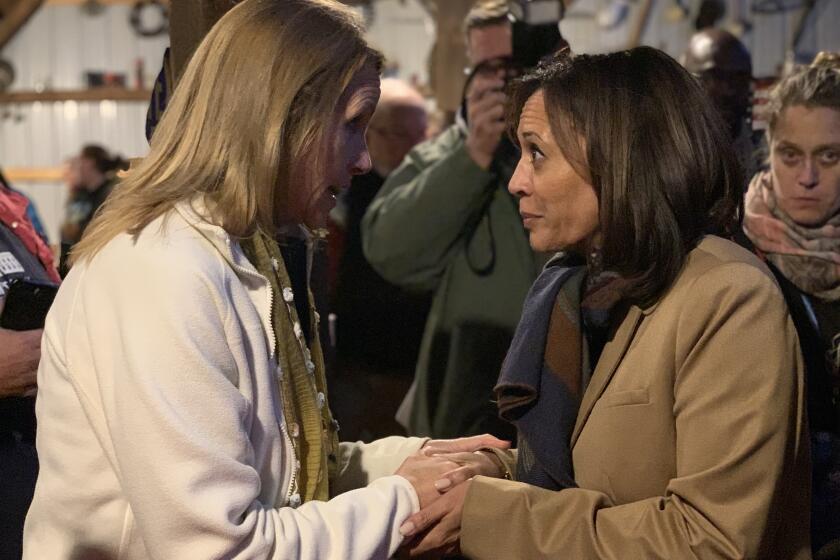
Kamala Harris, lagging in the polls, has cut staff and focused her efforts on Iowa, where she’s betting intimate events with voters will revive her chances.
Both Buttigieg and Warren have shown more support in recent polls in Iowa and New Hampshire, the states with the first contests in the nomination race, where the candidates have done the most campaigning.
But the current poll continues to show a lot of churn. That, plus the 21% of people who remain undecided, suggests the race remains unsettled.
“The undecided voters are a very big opportunity for things to change,” said Jill Darling, the survey’s director.
Because the poll surveys the same panel of people each month, it can track how voters stay with or change their minds about candidates. Most of the leading candidates held on to about two-thirds or more of the voters who backed them in September. Harris was the notable exception — she held on to only about one-third.
“The more people think about her, the less inclined they are to be for her,” said Bob Shrum, director of USC’s Center for the Political Future, which cosponsored the poll. “She’s not created a compelling message.”
When the poll asked Democratic voters for the main reason behind their choice, three came out on top — a preference for a candidate who “represents my own values and beliefs,” cited by 19%; one who has “the best chance of defeating Trump,” chosen by 17%; and one who can “bring major changes to the U.S.,” picked by 16%.
The share of voters who cited “values and beliefs” as their chief motivation has grown since the summer, while the share who cited candidates’ electability against Trump has waned, Shrum noted.
Biden continues to do best among those who cited beating Trump as the main reason for their choice, taking 72% of that group, with 11% each for Sanders and Warren.
The poll offers some support for the belief that Biden would fare better than Warren against Trump — at least at this point. Asked whether they would be happy or unhappy to see either of those candidates elected president, 28% said they would be completely unhappy about Warren, compared with 20% feeling that way about Biden. Independents and Republicans both were more likely to say they would be unhappy about a President Warren than a President Biden — suggesting she could have greater trouble winning swing voters.
Warren led among those who said their top priority was a candidate who could bring change —taking 34% of that group, compared with 24% for Sanders and 20% for Biden. She also led among those who opted for a candidate who represented their values and beliefs.
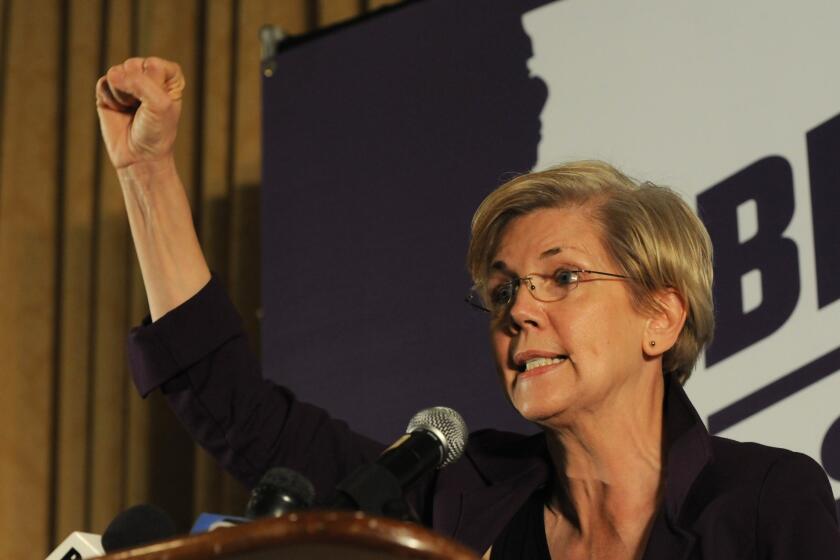
Democratic presidential candidate Elizabeth Warren proposes a $20-trillion ‘Medicare for all’ plan funded by hefty taxes on the rich and corporations.
Sanders led with a slightly smaller group who said the top reason for their choice was to have a candidate who “understands the needs of people like me.” He got 21% of that group, essentially tying with Biden’s 20%.
And what about those who remain undecided? Despite some highly publicized grumbling among Democratic activists, few voters yearn for more choices — only 4% of the undecided said they thought they had no good choices. About 40% said it was just too soon to make up their minds, and about the same share said they just didn’t know the candidates well enough yet.
This USC Dornsife/Los Angeles Times poll was conducted from Oct. 21 to Nov. 3 among 5,480 adult American citizens nationwide, including 2,599 who said they expected to cast ballots in a Democratic primary. The margin of error is 2 percentage points in either direction for the full sample and for the Democratic primary sub-sample. Respondents were drawn from a probability-based panel maintained by USC’s Center for Economic and Social Research for its Understanding America Study. The poll was conducted in partnership with, and funded by, the USC Dornsife Center for the Political Future. Responses among all eligible voters were weighted to accurately reflect known demographics of the U.S. population.
A description of the methodology, poll questions and data, and additional information about the poll are posted on the USC website.
More to Read
Get the L.A. Times Politics newsletter
Deeply reported insights into legislation, politics and policy from Sacramento, Washington and beyond. In your inbox twice per week.
You may occasionally receive promotional content from the Los Angeles Times.
