High Winds, Lack of Rain Are Blamed on La Nina
If you’re beginning to think that that song is right--that “it never rains in Southern California”--you’re not far from wrong this winter.
Santa Ana has had only 0.27 of an inch of rain since July 1, and Los Angeles has had only 0.84 of an inch. Although not a record for the period--that was set in 1962, with 0.12 of an inch in Los Angeles--it’s less than a sixth of the average of 5.32 inches.
The result is a serious fire hazard, officials say.
“It’s tinderbox dry,” said Garry Layman, a spokesman for the Orange County Fire Authority. “This is the longest, most dramatic fire season I remember in 30 years. We’re holding our breaths.”
The season’s rainfall totals are also among the nine lowest for July through December since record-keeping began in 1877. And there’s no rain in sight for the next week or more.
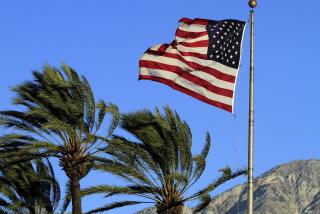
On top of that, it’s been windier than usual, with gale-force gusts Thursday that toppled big rigs on the Pomona Freeway near Pedley, tore the roof from a mobile home in Rialto and blew in the picture window of a house in Fontana. The winds caused the relative humidity to plummet, making life miserable for people with allergies and dry skin.
Meteorologists say you can probably pin the blame on La Nina, an enduring oceanic and meteorological counterpoint to the drenching El Nino season of 1997-98. During El Ninos, it’s usually wetter than normal in Southern California; during La Ninas, it’s usually drier, with an extra serving of powerful Santa Ana winds.
The current La Nina is well into its second year. During the 1998-99 season (July 1 through June 30), only 9.09 inches of rain fell on the downtown/USC reporting station. That compares with a normal season total of 15.09 inches and with the 31.01 inches that fell during the 1997-98 El Nino.
And the meteorologists say that it probably will remain drier and windier than normal well into the spring.
‘La Nina Still Looks Pretty Strong’
The National Oceanic and Atmospheric Administration said in its latest advisory that La Nina “is likely to continue for the next several months,” normally three of the rainiest in Southern California.
“La Nina still looks pretty strong,” said Guy Pearson, a meteorologist with WeatherData Inc., which provides forecasts for The Times. “The weather pattern looks pretty much the same for the next few weeks, with not much of a chance of rain in Southern California.”
During La Ninas, large, high-pressure weather systems tend to park off Central California and over northern Utah, as they were Thursday. Winds circulating clockwise around these systems dry out by compression as they funnel down Southern California’s coastal canyons, further parching already dehydrated hillsides and adding to the danger of unseasonable brush fires.
Thursday’s wind gusts peaked at about 121 mph in Orange County’s Bell Canyon, with velocity elsewhere ranging from 85 mph in Fremont Canyon to 25 mph in Garden Grove, Huntington Beach and Lake Forest. The wind reached 50 mph in the San Fernando Valley, fanning four small brush fires in the Porter Ranch area that firefighters were able to quench quickly. Farther east and south, the winds were stronger, with one gust measured at 93 mph at Fremont Canyon in the Santa Ana Mountains.
Gusts above 60 mph raked the Inland Empire, felling trees and stirring up immense clouds of dust. Driving became so hazardous that the California Highway Patrol temporarily closed a 9-mile stretch of the Pomona Freeway west of Beaumont and 15 miles of Interstate 15 below the Cajon Pass.
Despite the likelihood of at least two drier-than-normal years in a row, the Southland still is a long way from a widespread drought, say officials at the state Department of Water Resources.
As during most La Ninas, rainfall at the northern end of the state has continued to be near or above normal, and the state’s reservoirs now stand at about 115% of normal.
Forecasters say the current dry spell in Southern California is part of a recurrent cycle of weather patterns often influenced by the irregular emergence of El Nino and La Nina phenomena.
Nicholas Graham, a meteorologist with the International Research Center for Climate Predictions at the Scripps Institution of Oceanography in La Jolla, explained that the Pacific Ocean is essentially one vast basin, “with the water sort of sloshing back and forth.”
He said that under normal conditions, low-level equatorial trade winds blow from east to west, shoving water ahead of them that tends to pile up near Indonesia, raising the sea level there a foot higher than it is off the coast of Peru.
During El Nino, the trade winds slacken or even reverse, and the water sloshes back toward South America. This sloshing surface water presses down on cooler water beneath it that normally wells to the surface off Peru.
As a result, Graham said, the surface water there stays warmer than normal and starts ebbing west across the Pacific. This vast pool of warmer-than-normal surface water interacts with the atmosphere above it, increasing the storms generated over the central Pacific and amplifying the storm track that funnels precipitation into Southern California.
But El Nino also sows the seeds of its own destruction, setting up ocean and wind currents that ultimately reverse the phenomenon, Graham said. Sometimes, the reversal goes beyond normal, and the surface water off the west coast of Peru becomes abnormally cool. That’s what’s happening now, and it’s called La Nina.
During La Nina, the pool of cooler-than-normal surface water interacts with the atmosphere, again disrupting normal weather patterns. A large ridge of high pressure frequently remains anchored over the northern Pacific during the winter, diverting the storm track well north of Southern California.
(BEGIN TEXT OF INFOBOX / INFOGRAPHIC)
Windy Cities
Peak wind gusts Thursday from across Orange County. (in mph)
Peak gust: 121 mph
Avg. speed: 73 mph
*--*
Location Speed Bell Canyon 121 Freemont Canyon 85 Orange 43 Anaheim 34 Placentia 32 Newport Beach 31 Santa Ana 30 Laguna Beach 28 Garden Grove 25 Huntington Beach 25 Lake Forest 25
*--*
Bell Canyon Wind Speeds (in mph)
*--*
Time Avg. Peak 1/5/00 6 p.m. 23 47 7 p.m. 45 66 8 p.m. 18 69 9 p.m. 28 73 10 p.m. 46 81 11 p.m. 67 109 Midnight 73 121 1/6/00 1 a.m. 11 119 2 a.m. 16 25 3 a.m. 30 48 4 a.m. 11 55 5 a.m. 9 51 6 a.m. 35 55 7 a.m. 22 57 8 a.m. 14 33 9 a.m. 14 31 10 a.m. 14 37 11 a.m. 25 36 Noon 17 37
*--*
Graphics reporting by BRADY MacDONALD/ Los Angeles Times
Sources: California Dept. of Water Resources, KNBC/4 WeatherNet, National Weather Service
More to Read
Sign up for Essential California
The most important California stories and recommendations in your inbox every morning.
You may occasionally receive promotional content from the Los Angeles Times.


