Should you be panicking about a stock market crash?

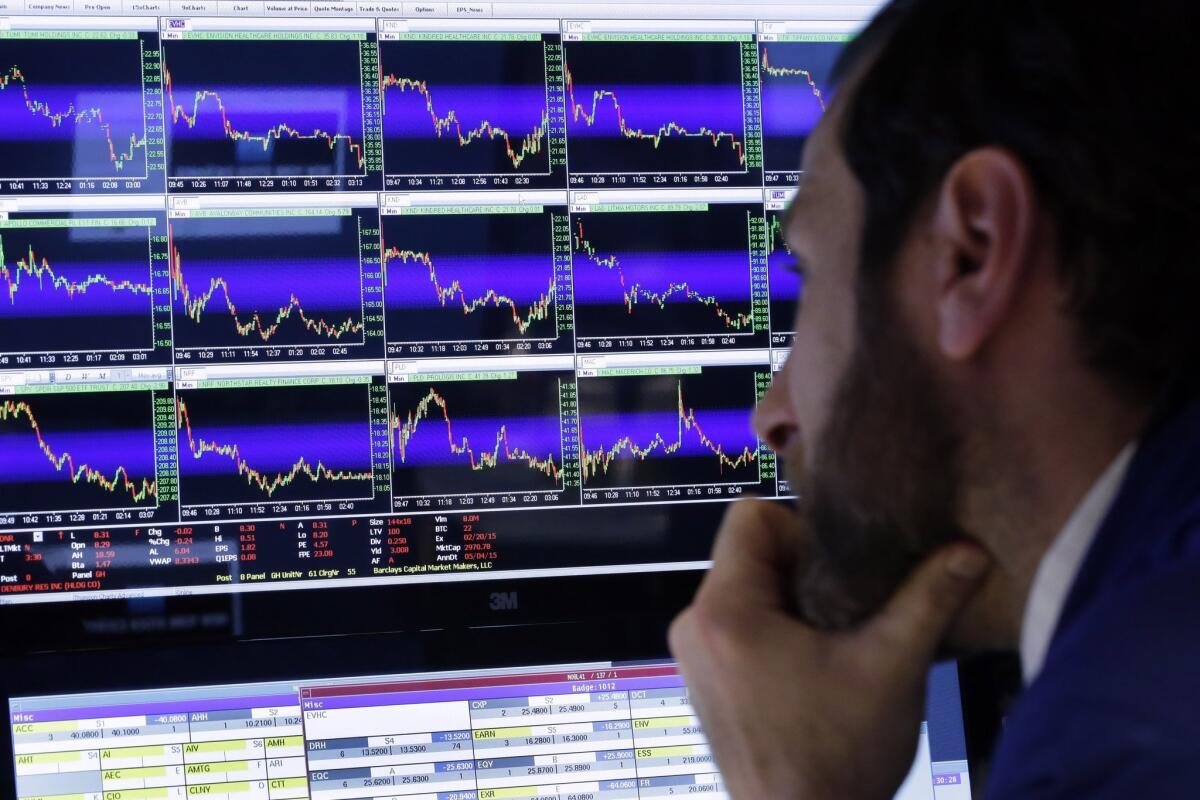
What do the charts say? A Big Board floor broker examines the price action of his shares.
Monday’s Wall Street Journal hauls out a hardy perennial of stock market reporting: a warning that a widely followed market analysis tool is flashing a “sell” signal.
In this case, the tool is the so-called Dow Theory, which was developed from the writings of Dow Jones co-founder Charles Dow of the Wall Street Journal in the early decades of the last century.
In its simplest formulation, Dow Theory holds that a rise in the Dow Jones Industrial Average must be matched, or “confirmed,” by a rise in the Dow Jones Transportation Average, or it’s heading for a fall. (The idea seems to be that if the Industrials are showing that production of goods is rising, you should see that in higher profits for the transport companies that carry goods from one place to another.)
Lately the Transports have been lagging. Hence Monday’s headline: “Dow Theory Has Investors Skittish on Market’s Next Leg.” A subhead warns that “a correction could be coming.”
This gives us a good opportunity to examine that peculiar form of stock market voodoo known as technical analysis, or “charting.” Chartists look for patterns in stock market behavior and try to divine what they tell us about the future.
In the opposing camp are “fundamental” analysts, who base their investment judgments on businesses’ profits and losses, revenues and expenses, and other basic metrics, and on expectations that growth in the past and present will continue into the future, carrying share prices along. Fundamental analysis isn’t foolproof, since no one can be 100% sure that the past is prologue to the future. But there’s reason to think that the market in general tracks overall economic growth, which is based on fundamentals.
You won’t convince chartists or fundamentalists that they’re wrong, so for the average investor, it’s probably best not to try. That’s why the most reliable strategy for the average investor is to invest in the broad market and not look for hints and tips in the interstices. We wrote about this strategy just last week, referencing the work of Burton Malkiel.
Malkiel had little use for chartists, whom he called “a small but abnormally dedicated cult” in his classic book, “A Random Walk Down Wall Street.” He was wary of fundamental analysis too, observing, “stock prices are in a sense anchored to certain ‘fundamentals,’ but the anchor is easily pulled up and dropped in another place.”
No one can consistently outperform the basic strategy of buying a portfolio that reflects the overall market (i.e., an index fund) and holding on for the long term, Malkiel concluded. So buy-and-hold is the way to go. It’s also cheaper in commissions, fees and taxes.
Yet technical analysis is still popular, thanks in part to chartists’ frequent appearances on outlets such as CNBC. The Dow Theory is perhaps the most widely followed technical model. Possibly that’s because it’s associated with the Dow Jones-published Wall Street Journal, but also because it has been around so long, dating from about 1902, that it’s been subjected to lots of testing. Unfortunately, those tests of whether it works, regarded objectively, are inconclusive.
The first major test was conducted by one Alfred Cowles in 1934. He looked at Dow Theory results from 1902 to 1929 and found that investment returns from following the theory lagged the overall market.
Dow Theory fans today point to a 1998 reexamination by Stephen J. Brown of NYU and William N. Goetzmann and Alok Kumar of Yale as having debunked Cowles and validated the Dow Theory. To this, we can say: Well, sort of. But not really.
Their paper did say that tweaking Cowles’ calculations to adjust for risk implied a slightly better result for the Dow Theory than for a conventional buy-and-hold strategy, and that it could conceivably be applied going forward.
They also pointed out, however, that their finding rested not on the “Dow Theory” as such, but on how it was applied by its leading exponent, William Peter Hamilton, who became editor of the Journal upon Charles Dow’s death in 1902 and continued until 1929. In that time, he wrote 255 editorials forecasting the market; Brown et. al. say those editorials are the real basis of the Dow Theory. Hamilton also wrote a book espousing the Dow Theory in 1922.
The problem is that it’s difficult to distinguish “Dow Theory” from Hamilton’s personal predictive skills. Brown and his partners try to pry the principles of Dow Theory from Hamilton’s writing using artificial intelligence. They think they’ve done so, but they acknowledge that the “theorems” he employed “are vague enough to admit a variety of statistical interpretations.” They also concede that “the recommendations in the editorials are not always clear.”
Their bottom line is that Hamilton was good at forecasting, but that’s not the same thing as saying the Dow Theory works. Hamilton did well over his 27-year reign, “but whether this means that his interpretation of the Dow Theory is correct, or whether it simply means that Hamilton was one lucky forecaster ... is still an open question.”
That points to the allure and the drawbacks of trying to time the market based on flashes from the Dow Theory and other models. There’s lots of give in them; sometimes chartists agree on the shape of their charts, but disagree on what they mean. Sometimes they’re wrong. Leading Dow Theorist Richard Russell predicted in January 2014 that that would be the year when “the excrement hits the fan.” He said his “instinct is to be in gold.”
The Dow gained 8.4% for the year and the S&P 500 gained 12.4%. Gold lost a couple of percent.
Sometimes they seem to have worked in retrospect and they produce fancy-looking charts that seem to say something, but their predictive power is doubtful. Is a correction or a crash coming? Maybe. Maybe not. But you can’t tell from the Dow Theory.
Keep up to date with the Economy Hub. Follow @hiltzikm on Twitter, see our Facebook page, or email mhiltzik@latimes.com.
More to Read
Inside the business of entertainment
The Wide Shot brings you news, analysis and insights on everything from streaming wars to production — and what it all means for the future.
You may occasionally receive promotional content from the Los Angeles Times.


