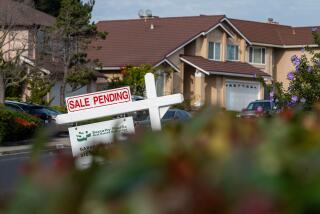
AVERAGE SALES PRICES OF NEW HOMES
Average sales prices of new homes in California and the United States from 1970 to 1989.
Percent United Percent Year California Increase States Increase 1970 $39,900 N/A $26,600 -4.66% 1971 35,000 -12.28% 28,300 6.39 1972 38,000 8.57 30,500 7.77 1973 42,400 11.58 35,500 16.39 1974 47,400 11.79 38,900 9.58 1975 54,500 14.98 42,600 9.51 1976 65,400 20.00 48,000 12.68 1977 73,600 12.54 54,200 12.92 1978 90,200 22.55 62,500 15.31 1979 102,800 13.97 71,800 14.88 1980 118,000 14.79 76,400 6.41 1981 120,500 2.12 83,000 8.64 1982 126,300 4.81 83,900 1.08 1983 132,700 5.07 89,800 7.03 1984 134,900 1.66 97,600 8.69 1985 143,000 6.00 100,800 3.28 1986 154,000 7.69 111,900 11.01 1987 173,900 12.92 127,200 13.67 1988 192,600 10.75 138,300 8.73 1989 223,000 15.78 149,300 7.95 Average 105,405 9.75 74,855 8.36
SOURCE: The Meyers Group
More to Read
Inside the business of entertainment
The Wide Shot brings you news, analysis and insights on everything from streaming wars to production — and what it all means for the future.
You may occasionally receive promotional content from the Los Angeles Times.


